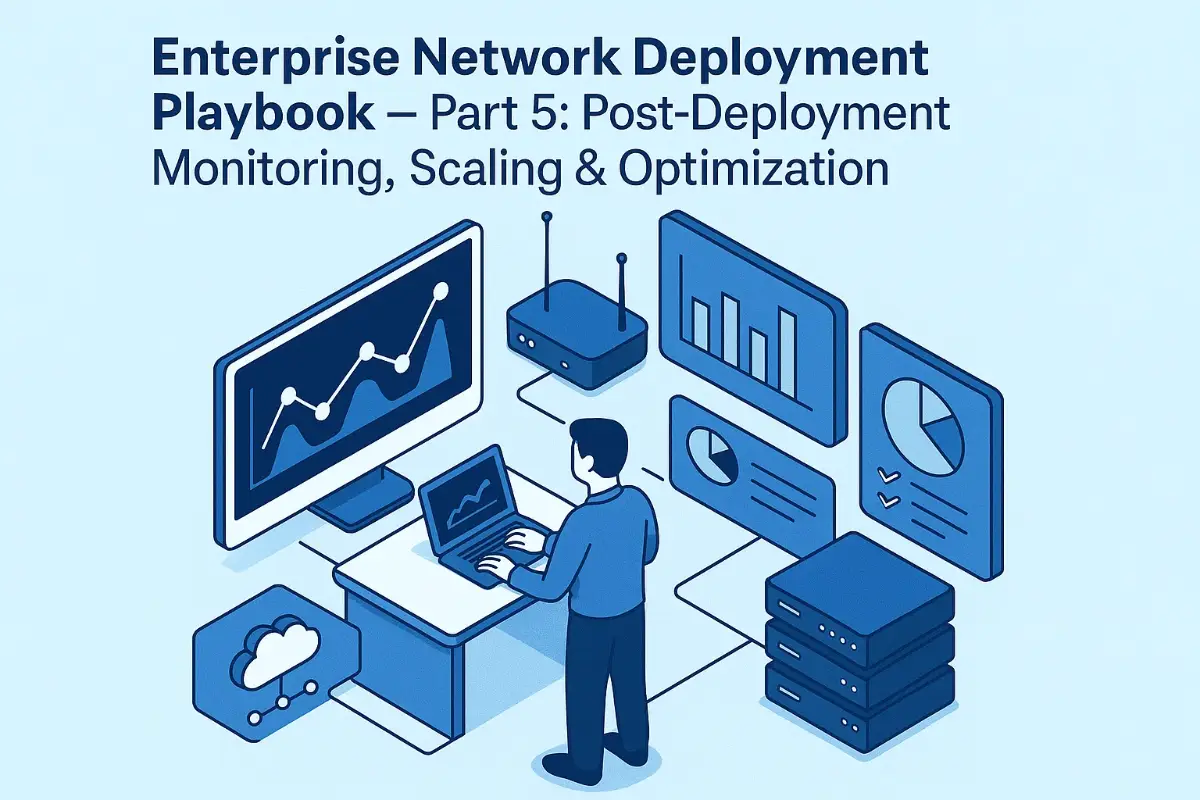
Enterprise Network Deployment doesn’t end when LEDs turn green. The real scorecard starts on “Day 2+”—that long haul where uptime, speed, and cost efficiency either make heroes of outsourcing teams or send CFOs hunting new vendors. Building on our Part 3 go-live victory lap and the iron-clad security fabric from Part 4, this final chapter dives deep into the gritty, coffee-fueled world of post-deployment operations. Grab that mug; we’re gonna keep this network humming.
Define the Operational Charter: Who Owns What After Go-Live?
Before the confetti lands, nail down an Operational Charter that maps every Enterprise Network Deployment component to a named owner and KPI. Our managed-service provider (MSP) contract usually splits duties:
- MSP NOC: 24 × 7 monitoring, incident triage, firmware lifecycle, capacity forecasting.
- In-house IT: local patching for legacy OT gear, end-user onboarding, exec escalations.
- Third-Party SOC: threat hunting, forensics, compliance evidence packs.
Pin KPIs to each role—Mean Time to Detect, Mean Time to Contain, Percent Capacity Headroom. Publish the charter in the same Confluence space we used for Parts 1-4 so nothing slips through the cracks.
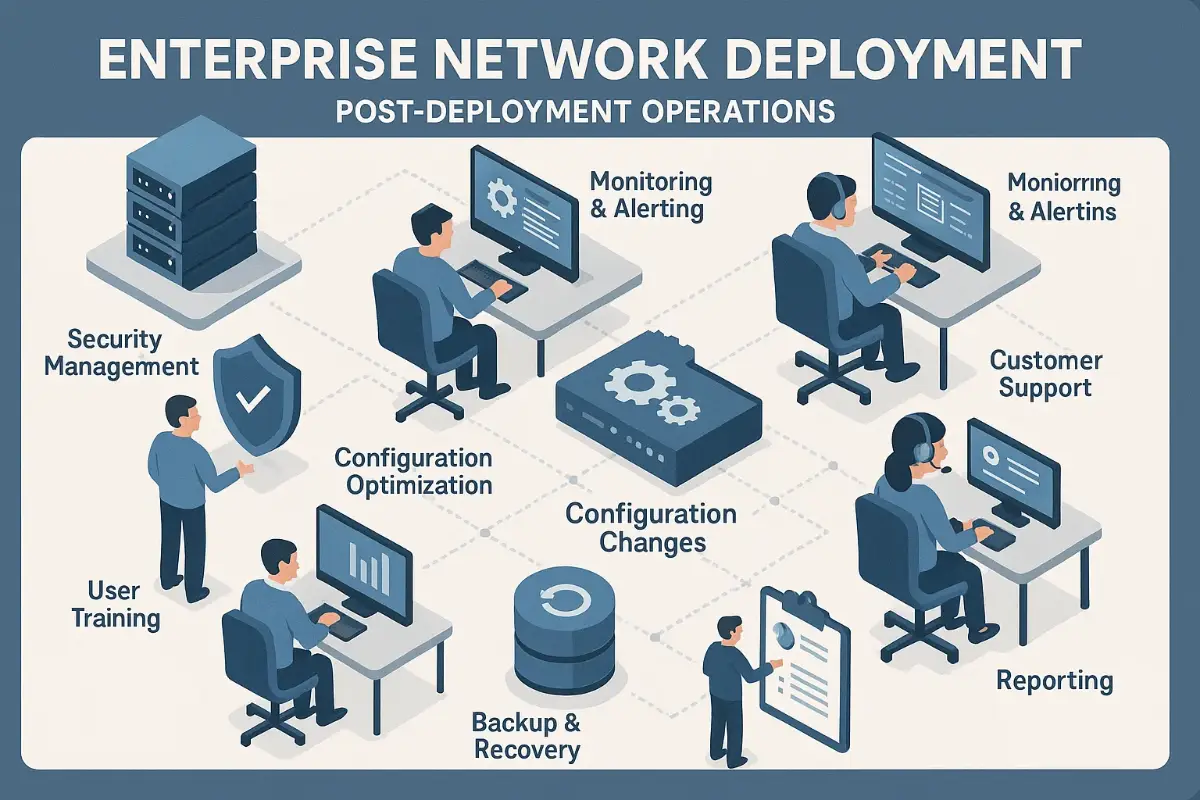
Build a Full-Stack Observability Pipeline
Monitoring isn’t a single pane of glass; it’s an orchestra. Our Enterprise Network Deployment observability stack layers three data domains:
- Metrics (SNMP, gNMI, sFlow): bandwidth, errors, CPU, memory.
- Traces (OpenTelemetry, Jaeger): hop-by-hop latency inside microservices.
- Logs (Syslog NG → Elastic): events, config changes, security alerts.
Grafana sits on top, fed by Prometheus for metrics and Loki for logs. One dashboard lights up every WAN link, spine buffer, and firewall session-table in a 30-second scrape cycle. Add a tiny PromQL rule—sum(rate(ifErrors[5m])) > 5—and our on-call phone chimes before users tweet rage.
Key Performance Benchmarks: Turning Raw Data into Business Truth
Enterprises care less about packets than customer conversions and plant uptime. We translate network health into business KPIs:
| Technical Metric | Business KPI | Target |
|---|---|---|
| 95th-percentile WAN latency < 80 ms | Checkout page load < 2 s | 99.9 % |
| Spine buffer drops/port/day | ERP transaction success | < 5 |
| Branch SD-WAN jitter < 30 ms | VoIP call quality MOS ≥ 4.2 | 99 % |
Every board pack starts with these KPIs up top; raw graphs move to the appendix for the geeks.
Alerting Playbook: Noise Down, Relevance Up
Flooding pagers helps nobody. We tier alerts:
- P1 Critical: user-visible outage, SLA penalty risk. → Phone + SMS + Slack + escalations.
- P2 Major: redundancy at risk, capacity over 85 %. → Slack + e-mail.
- P3 Minor: single flapping link, high CPU spike. → Slack only.
Each alert threads to a /noc-incident-1234 Slack channel with predefined checklists: verify, isolate, remediate, root-cause. We stole this flow from SRE circles and it chops Mean Time to Resolve on Enterprise Network Deployment tickets by roughly 40 %.
Remember in Part 2 when we budgeted for 2× traffic growth? Users will still punch past forecasts. We feed 30-day rolling averages into a Prophet model—daily seasonality for office hours, weekly for batch jobs, yearly for holiday peaks. The model spits out a 90-day headroom trend. If projected utilization breaches 70 % on any core link, our change-management queue spins a Scale-Up epic:
from fbprophet import Prophet
df = df.rename(columns={'timestamp': 'ds', 'utilization': 'y'})
model = Prophet(daily_seasonality=True, weekly_seasonality=True)
model.fit(df)
future = model.make_future_dataframe(periods=90)
forecast = model.predict(future)
alert = forecast[forecast['yhat'] > 0.7].head(1)
New QSFP56 optics arrive before saturation—no overtime call-outs, no CFO surprises. Scaling stays proactive, never reactive.
Performance Tuning: Squeezing the Last Millisecond
If monitoring is the stethoscope, tuning is the surgery. Five quick wins our MSP toolbox leans on:
- Deep Queue WRT: enable Weighted Random Early Detection on WAN egress to kill bufferbloat.
- TCP MSS Clamping: slash overhead on IPsec tunnels crossing varied MTUs.
- Adaptive QoS: dynamically adjust DSCP markings based on flow heuristics from NBAR2.
- Firmware Hot-Patch: leverage ISSU on chassis so line cards ingest bug fixes field-hot.
- Inline TLS Offload: shift decryption to SmartNICs, freeing CPU cycles on firewalls.
One retail chain saw cart abandonment drop 6 % after we shaved 120 ms off their checkout API latency—ROI everyone can taste.
Automation Loop: Git-Ops for Day-N Changes
Manual tweaks breed drift. Every Enterprise Network Deployment change, no matter how trivial, rides the same Git merge pipeline we built in Part 3:
- Developer commits YAML intent.
- CI spins a containerized lab replica, runs PyATS testbed.
- Senior engineer approves Merge Request.
- GitLab runner pushes to production via Nornir.
- Post-change PyATS diff confirms parity with intent; failure auto-rollbacks.
We average 18 network code merges per week without after-hours downtime—pure DevNetOps bliss.
Cost Optimization: Turning Savings into Business Wins
Networks don’t live in vacuum tubes; they live in budgets. Cost trims we apply post-deployment:
- Port Right-Sizing: shift idle 10 G access ports to 1 G optics overnight using LLDP idle scans.
- Energy Profiles: enable Adaptive Power via PoE++ to throttle wattage on low-draw APs.
- License Audits: nuke dormant SD-WAN cloud licenses; charge-back to departments.
- Traffic Shaping: steer bulk updates to off-peak windows, downsizing DIA bursts.
Last quarter we shaved $42 k USD annual OpEx for a logistics giant—money that bought them a shiny new DR site.
Security Drift & Continuous Hardening
Vulnerabilities never nap. Tie your security scans to the monitoring stack:
- Nightly Nessus Sweep: export findings to Elastic, auto-group by CVSS.
- Weekly CIS Benchmark: run Lynis on network OS images and Linux bastion hosts.
- Quarterly Red-Team Exercise: injection of custom IOCs to measure dwell time.
If a CVE scores 8.0+, our SLA demands patch within seven days; ISSU keeps things rolling without disrupting users.
Transition from Hypercare to Steady State
The hypercare window we outlined in Part 3 ends once:
- All critical and major incidents stay zero for 14 consecutive days.
- Capacity headroom > 30 % on every core link.
- Security scan shows no High findings.
- Customer success survey hits ≥ 4.5 / 5.
At that moment we flip from 24 × 7 war-room to standard NOC cadence. The Microsoft Defender security guide becomes required reading for client desktop teams to sustain endpoint hygiene that feeds our SIEM.
Customer-Facing Reporting & Continuous Improvement
Data means squat if execs don’t read it. Our monthly executive deck breaks down:
- Availability: uptime, P1 incidents, SLA credits avoided.
- Performance: top APIs latency, call-center MOS scores.
- Cost: bandwidth optimization, license retirement.
- Security: blocked threats, patch velocity.
- Roadmap: next-quarter upgrades, forecasted spend.
Each slide links back to Grafana via permalinks for self-service deep dives.
Anecdote: The Holiday Traffic Tsunami That Never Drowned Us
Last December a fashion retailer projected Black Friday traffic at 3× normal. Our forecast model screamed 6×. Procurement balked at added circuits. We convinced them to pilot burstable cloud direct-connect lines. Come Turkey Day, traffic peaked at 5.7×—we rode the wave without a single cart error. CIO’s thank-you note now hangs in our war-room.
External Resources & Continuous Learning
- Datadog Network Monitoring overview – crisp visuals for capacity and flow insights.
- Cloudflare Anycast primer – a solid explainer when global failover talks crop up.
Series Wrap-Up: Where Do We Go From Here?
Five parts, tens of thousands of words, and a truckload of field scars later, our Enterprise Network Deployment Playbook is complete. From Discovery to Zero-Trust hardening, you now own a blueprint that scales, heals, and saves money. Next quarter we’ll launch a bonus mini-series on cutting-edge SD-WAN SASE convergence—until then, keep those dashboards green and those change windows boring.